About this Page
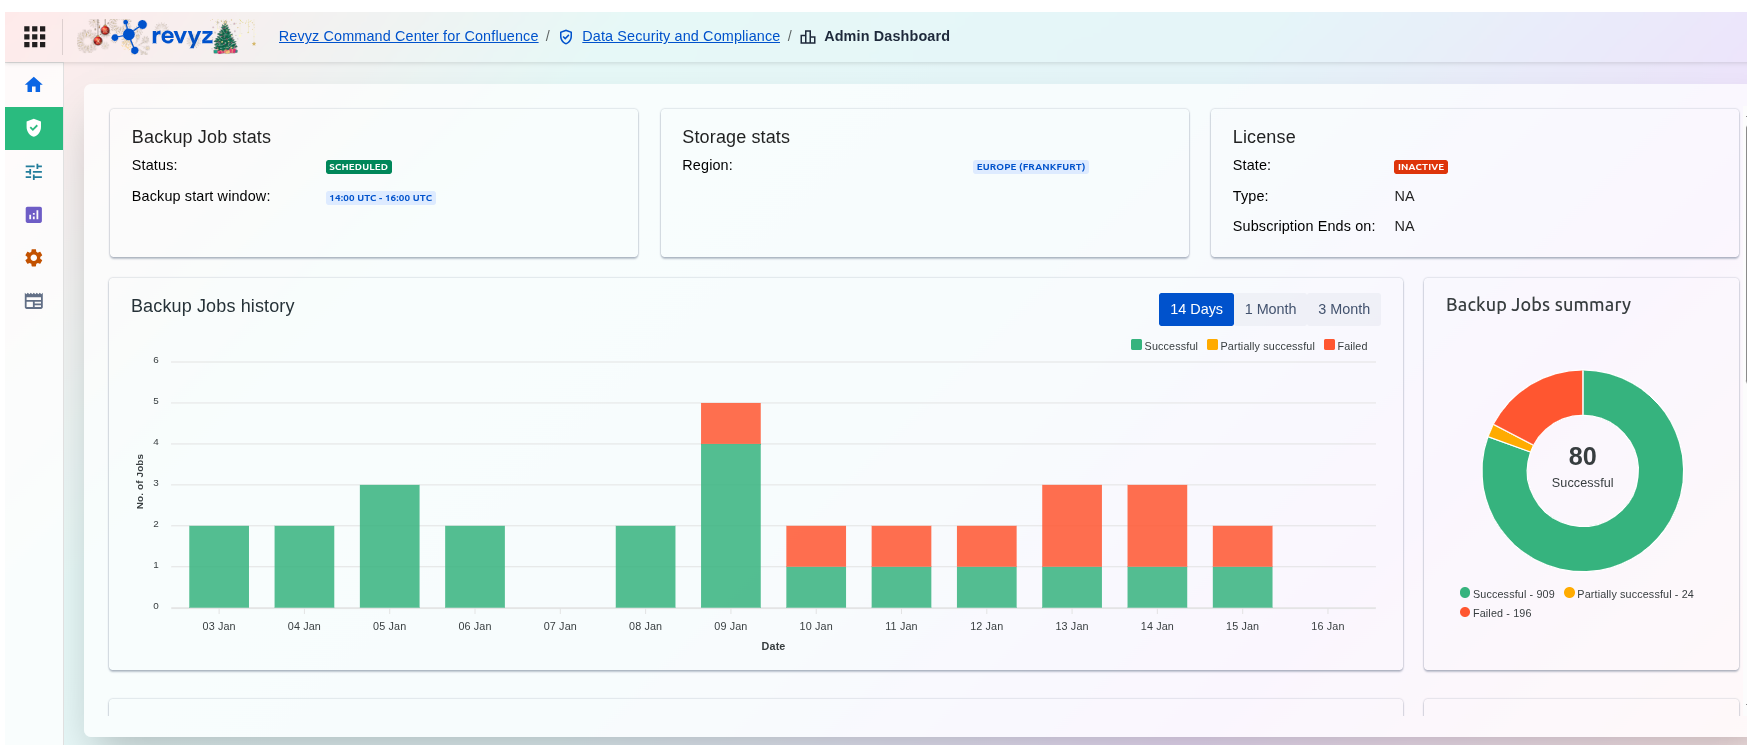
The Admin Dashboard is designed to give administrators at-a-glance visibility into the current state of their Confluence backups. It combines real-time configuration details with historical data visualizations to help identify trends, ensure compliance, and quickly spot any backup failures that require attention.
Sections in the Admin Dashboard
Backup jobs
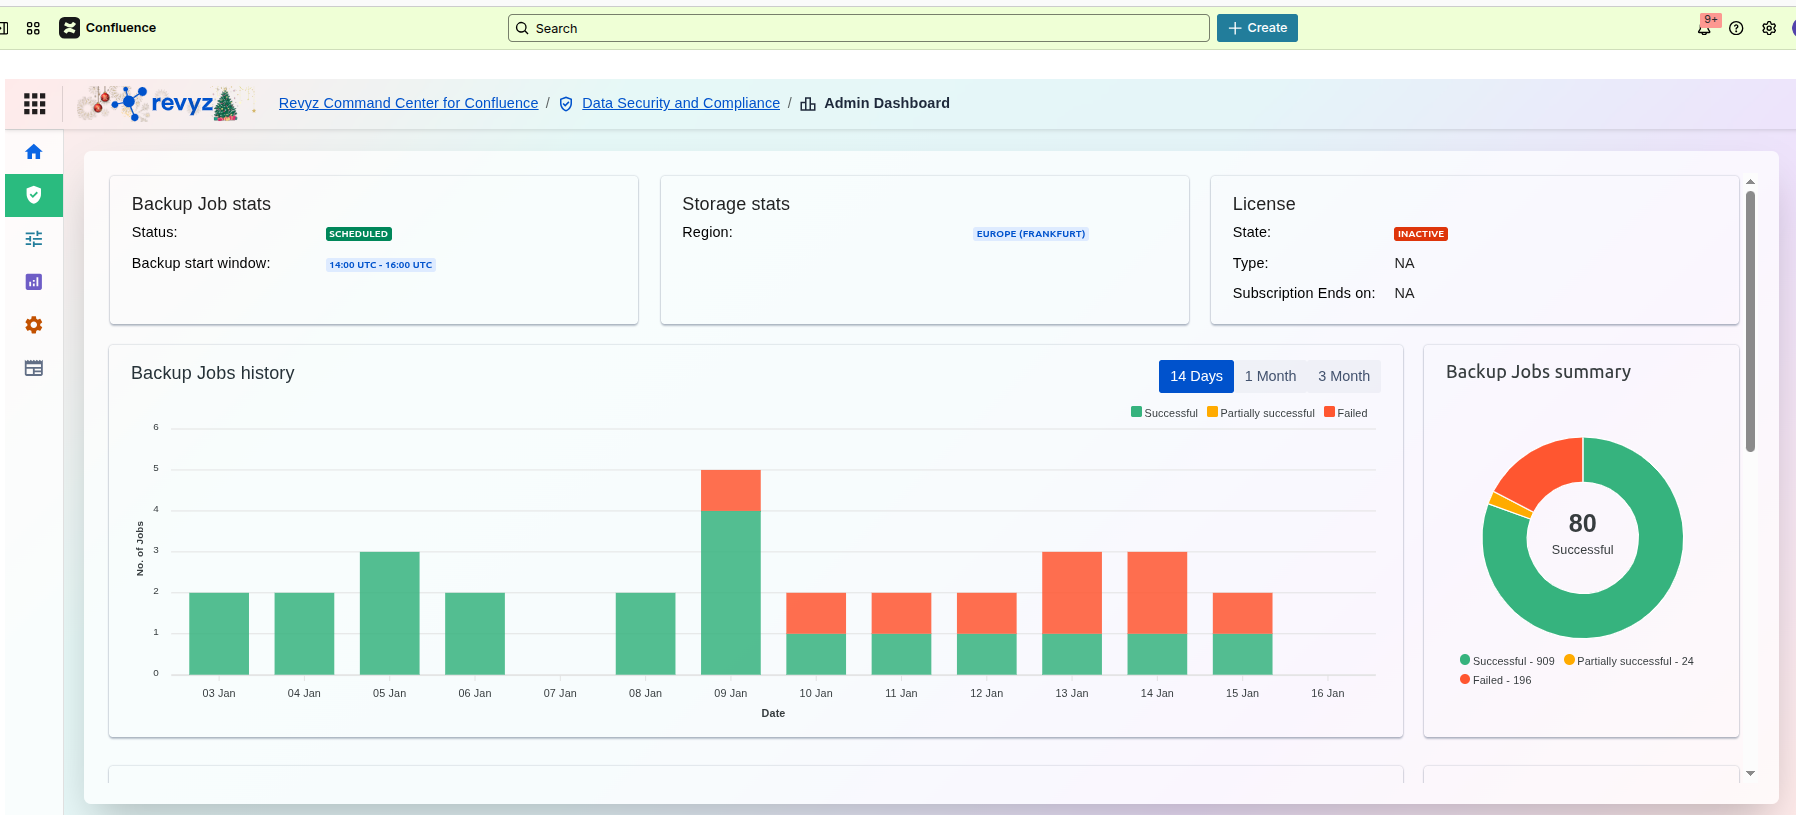
Backup Job Stats
This panel provides a high-level "health check" of your automated backup schedule. Instead of digging through logs, you can glance here to confirm that your Confluence data is being protected as expected.
Content Delete History
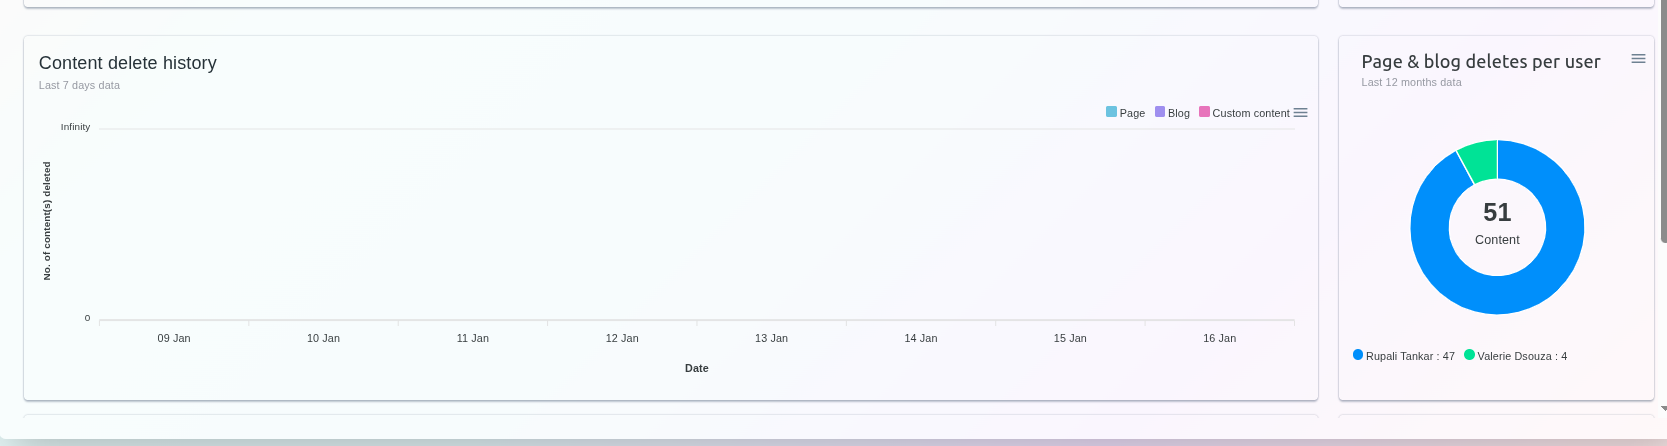
Content Delete History
This line chart tracks the volume of deletions over a rolling period (shown here as the Last 7 days). It allows you to visualize spikes in activity that might indicate a bulk cleanup or accidental data loss.
-
Categorized Tracking: The chart distinguishes between different types of deleted items, including Pages, Blogs, and Custom content.
-
Time-Based Analysis: By tracking deletions by date, you can correlate data loss with specific events or project milestones.
Page & Blog Deletes Per User
This panel provides a breakdown of who is deleting content, focusing on data from the Last 12 months.
-
User Breakdown: The donut chart visually represents the proportion of deletions attributed to specific team members.
-
Total Count: The center of the chart displays the total number of content items deleted across the specified timeframe.
Space Content Delete History
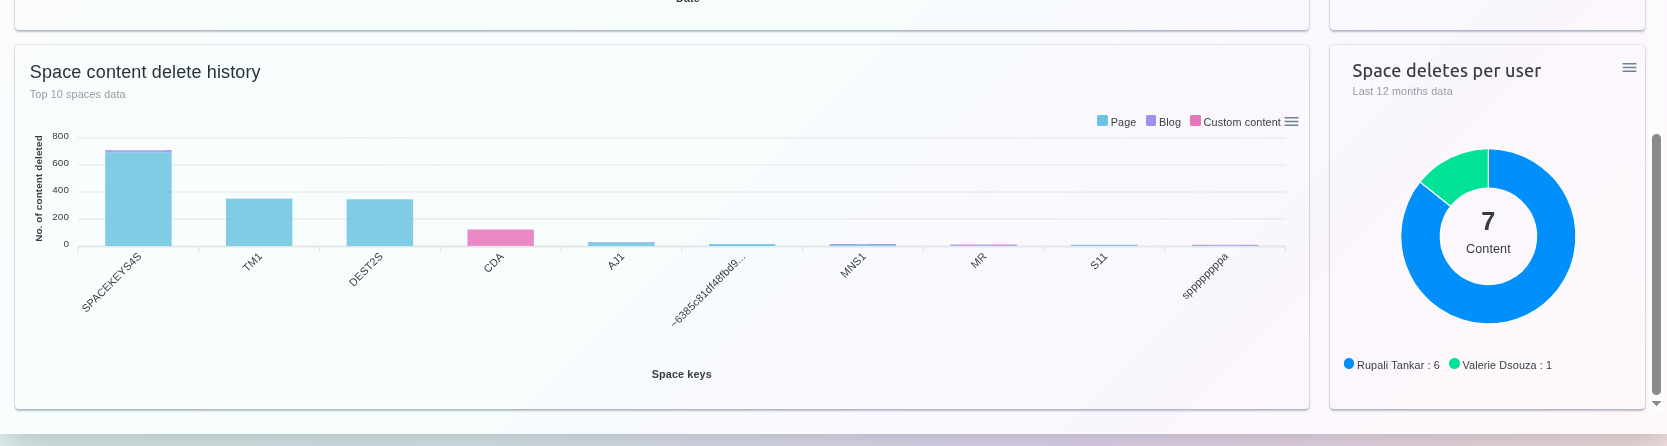
Content Delete Tracking
The deletion analytics are split into two primary views: a chronological history of what was deleted and a breakdown of who performed the deletions.
Content Delete History
This graph tracks the volume of deleted items over the Last 7 days.
-
Visual Trends: The chart maps the number of content items deleted per day, allowing you to quickly spot unusual spikes in activity.
-
Content Categories: Deletions are categorized by type, including Pages (light blue), Blogs (purple), and Custom content (pink).
Page & Blog Deletes Per User
This widget offers a summary of deletion activity over the Last 12 months, attributed to specific users.
-
Total Impact: The center of the donut chart displays the total count of content items deleted during the period.
-
User Attribution: The chart and legend identify the top contributors to content deletion, along with the exact number of items each has removed.