This page talks about the Revyz Admin Dashboard, which is your central command center for monitoring the health and status of your data protection activities. It provides a high-level overview of backup jobs, storage usage, license information, and recent activity at a glance.
What is the Use Case?
The Admin Dashboard serves as your primary starting point, presenting the most critical operational metrics in a single, easy-to-read interface. It features widgets that display the status of your most recent backup and restore jobs.
It also highlights key findings from the latest site health reports, pointing out potential configuration issues before they escalate.
This centralized view helps you proactively monitor the environment, identify potential risks, and quickly navigate to the tools needed to manage their data protection and disaster recovery strategies effectively.
It helps you track inactive users, deletions, and manage your Jira and Confluence sites.
Command center for jiraconfig manager for jiraassets data manager for jira
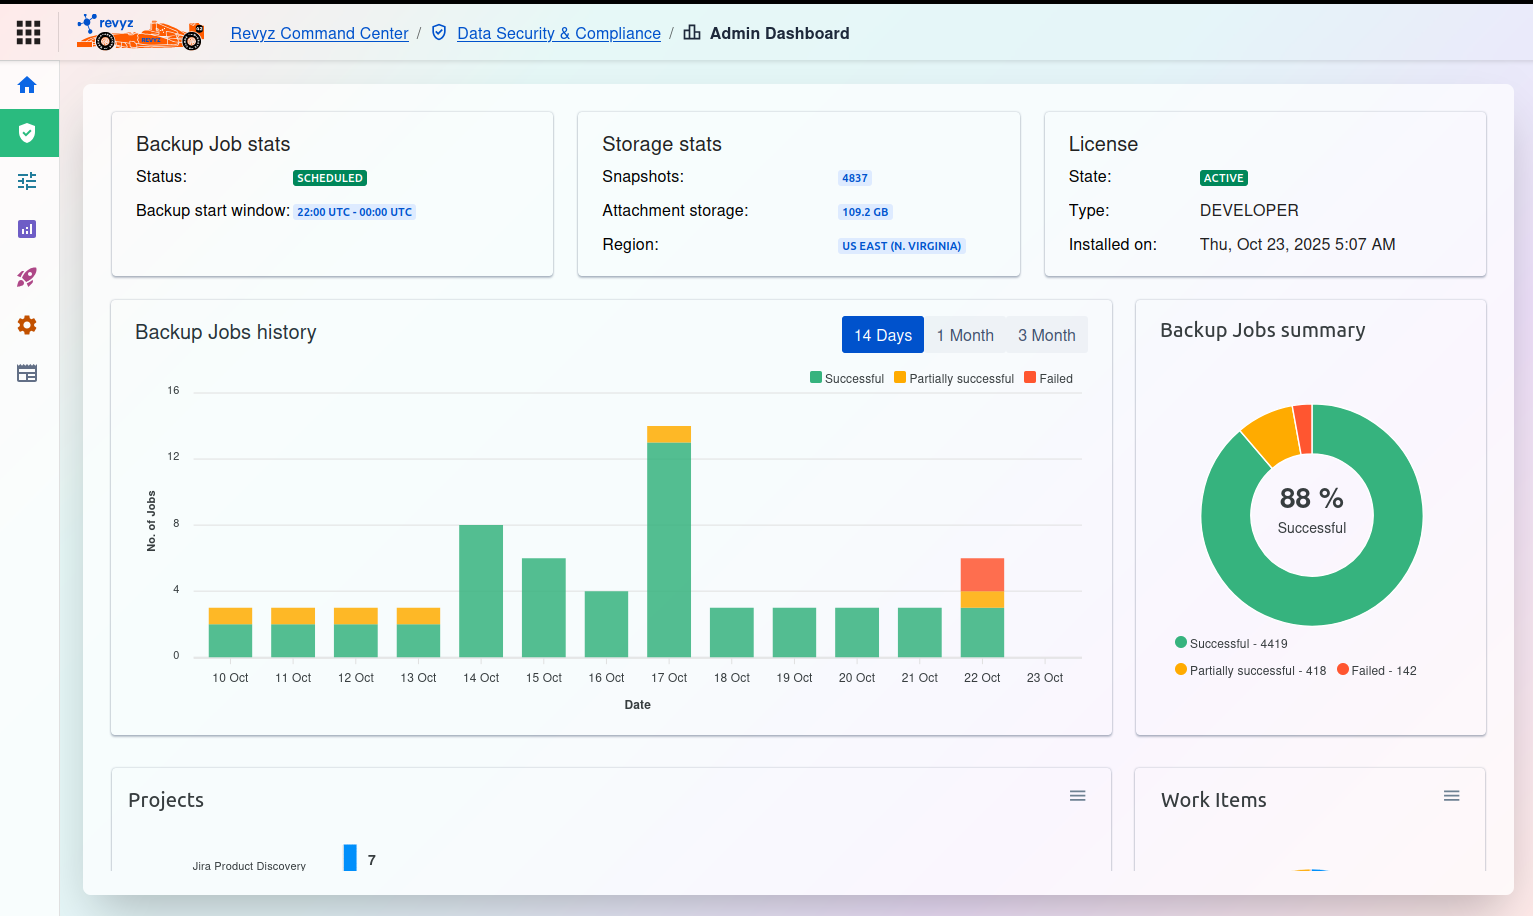
1. Top Status Bar
This section provides real-time, critical information about your Revyz instance.
1. Backup Job stats
This card shows the current state of the backup scheduler.
Status: Indicates the immediate status of the backup process. In this example, QUEUED means the system is waiting for the next scheduled backup window to begin. Other statuses may include RUNNING, IDLE, or FAILED.
Backup start window: This is the designated time frame during which your daily backup jobs will automatically start. The time is shown in Coordinated Universal Time (UTC). In the example, jobs are scheduled to begin between 00:00 UTC and 02:00 UTC.
2. Storage stats
This card summarizes your backup storage consumption and location.
Snapshots: The total number of recovery points (snapshots) currently stored. Each successful backup job creates one or more snapshots.
Attachment storage: The total disk space consumed by backed-up attachments.
Region: The physical cloud storage region where your backup data is securely stored (e.g., US EAST (N. VIRGINIA)).
3. License
This card displays the details of your Revyz software license.
State: Shows if your license is ACTIVE or EXPIRED.
Type: Describes the license type, such as Commercial (Trial) or Enterprise.
Installed on: The date and time the current license was activated.
2. Backup Jobs Monitoring
This section provides a detailed look at the performance and history of your backup jobs.
1. Backup Jobs history
This bar chart visualizes the trend of your backup jobs over a selected period.
Controls: You can filter the view to show the last 14 Days, 1 Month, or 3 Month.
Y-axis (No. of Jobs): Represents the number of backup jobs run on a specific day.
X-axis (Date): Shows the date range for the displayed history.
Legend:
Green (Successful): The job completed without any errors.
Yellow (Partially successful): The job completed, but some non-critical items may have been skipped or encountered issues.
Red (Failed): The job did not complete due to critical errors.
In the example, we can see one successful backup job was completed on October 8th.
2. Backup Jobs summary
This donut chart provides an aggregate summary of all backup jobs run over a longer period.
Percentage: The large number in the center (50%) shows the overall success rate.
Legend & Count: The breakdown provides exact counts for each status:
Successful: 13 jobs
Partially successful: 1 job
Failed: 12 jobs
Note: The Backup Jobs summary chart shows all-time statistics, while the Backup Jobs history chart is filtered for a specific recent period (e.g., 14 days). This is why the counts between the two charts may not match.
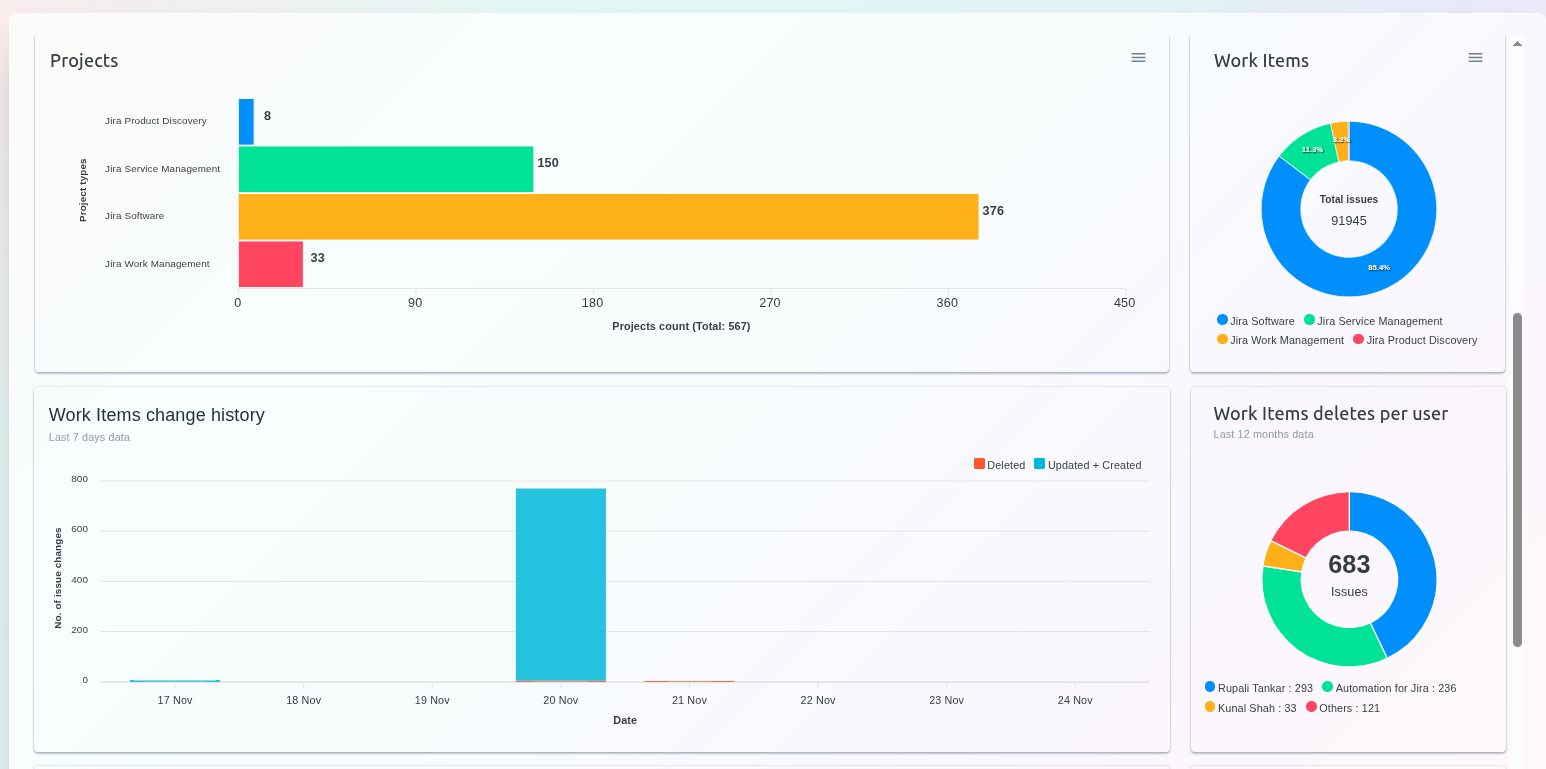
3. Projects and Work Items
These cards provide insights into the specific items being managed and protected by Revyz.
1. Projects
This area lists the projects configured for backup (e.g., from integrated platforms like Jira) and displays the count of items within them that are being protected.
2. Work Items
This card likely shows a summary or count of individual work items (like tickets, issues, or pages) that are included in the backup scope.
4. Work Items change history & Deletes
These cards tracks the recent activity and lifecycle changes occurring on your work items.
Work items Change History
This is a bar chart tracking the No. of issue changes over the last 7 days. Changes are segmented into Deleted and Updated + Created actions. It provides a critical snapshot of recent data activity, allowing administrators to identify sudden spikes in deletion, creation, or update activity that may require investigation or highlight heavy workflow usage.
Work items deletes per user
This card is an important audit tool that helps track data destruction over time. This is a donut chart showing the Total deleted Issues (e.g., 683) over the Last 12 months and attributes these deletions to the users or processes that performed them (e.g., individual users or "Automation for Jira").
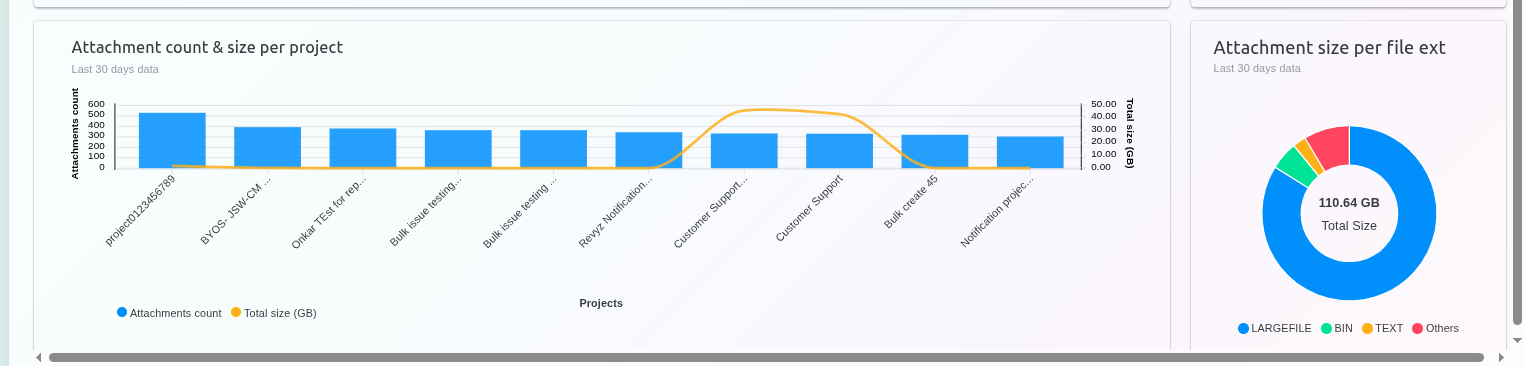
5. Attachment count & size per project
These cards visualize the distribution of Jira attachment count and total size across different projects and categorizes the overall attachment size by file type over the last 30 days.
Attachment Count
This chart ranks projects based on the number of attachments created (blue bars) and overlays the corresponding total size in GB (orange line) over the last 30 days.
Attachment size per file extension
The pie diagram for "Attachment size per file ext" represents the total storage consumption by attachments in your Jira instance over the last 30 days, broken down by the type of file extension. It visually quantifies the distribution of the across categories like LARGEFILE, BIN, TEXT, and Others.