What is this feature?
This is a powerful comparison tool that allows you to analyze your Jira and Assets configurations between two different backup snapshots. It provides a detailed, item-by-item report of all changes.
-
Use Case: Use this to identify "configuration drift," which are unintended changes that have occurred over time. It's perfect for comparing your production site against a "golden" baseline snapshot or for comparing a staging site to production to ensure consistency.
Assets, XRay, Tempo Configuration Drif Analytics tools of the Revyz Command Center for Jira are unavailable for Revyz Configuration Manager for Jira.
To upgrade your version to Revyz Command Center for Jira, connect with support@revyz.io or install the app here.
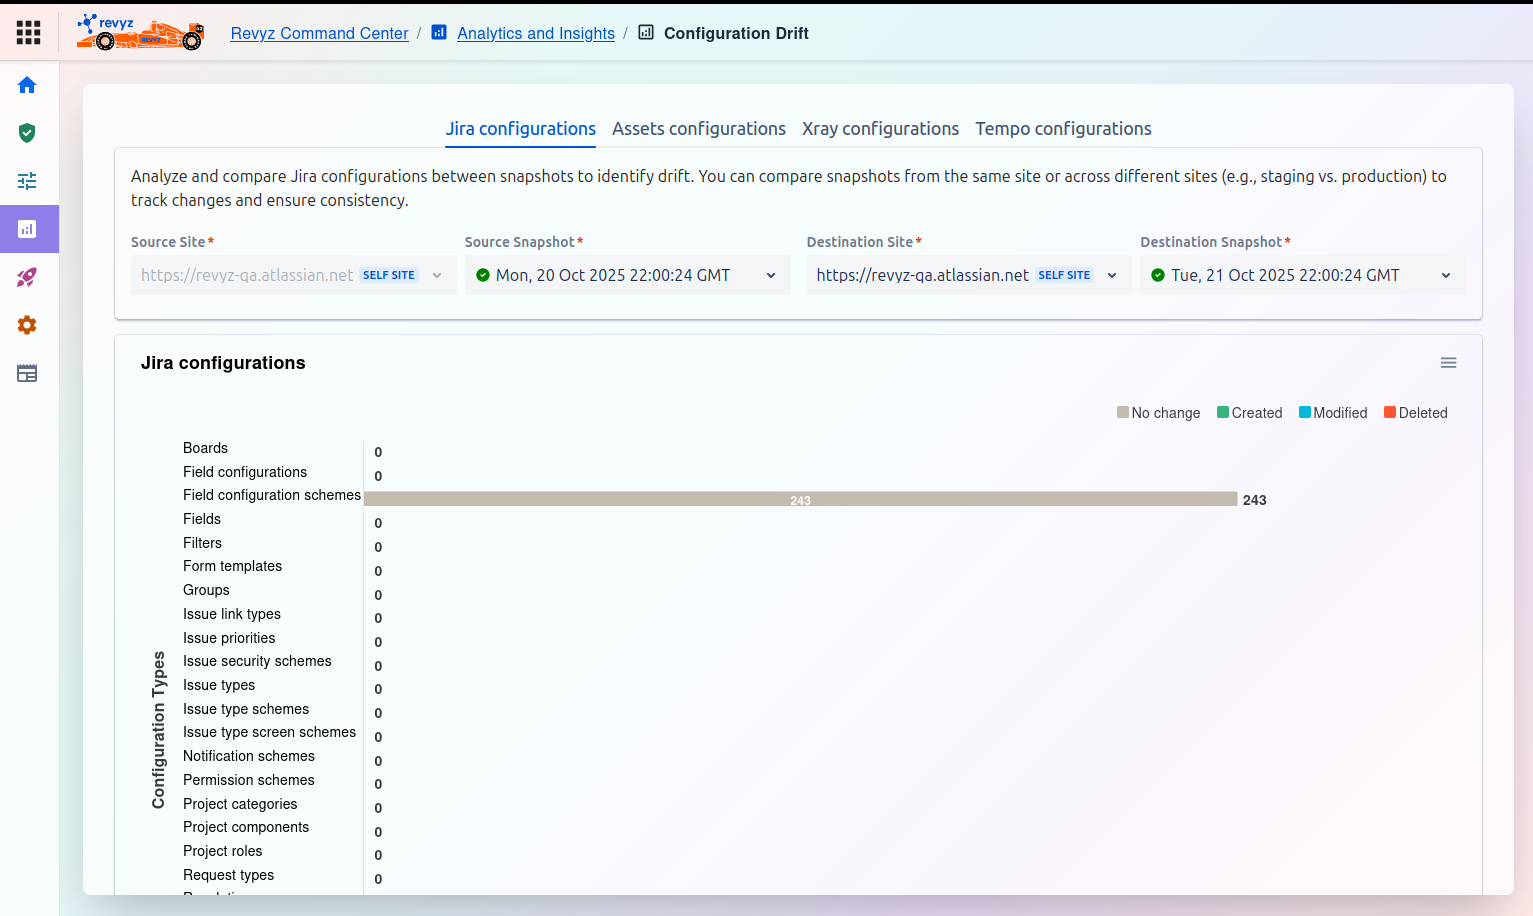
This is the main dashboard for running a drift analysis. You must select two snapshots (a "source" and a "destination") to compare.
Configuration Types (Tabs)
You can run an analysis on different parts of your system by selecting the appropriate tab:
-
Jira configurations (Selected in the screenshot)
-
Assets configurations
-
Xray configurations
-
Tempo configurations
The description below the tabs explains that you can analyze and compare configurations between snapshots from the same site or across different sites (e.g., staging vs. production) to identify drift and ensure consistency.
1. Select Sources for Comparison
At the top of the screen, you must select the two points in time you want to compare:
-
Source Site
*: The first Jira instance you want to compare from. -
Source Snapshot
*: The first (or "baseline") snapshot you want to use for the comparison (e.g.,Mon, 21 Oct 2025 22:00:24 GMT). -
Destination Site
*: The second Jira instance you want to compare to. This can be the same as the Source Site. -
Destination Snapshot
*: The second (or "current") snapshot you want to compare against the baseline (e.g.,Tue, 21 Oct 2025 22:00:24 GMT).
2. Review Analysis Results
Once you have selected both snapshots, the tool generates a report in the "Jira configurations" section.
-
Legend: A color-coded legend at the top right of the chart indicates the type of change:
-
Gray: No change
-
Blue: Created (newly added in the destination snapshot)
-
Yellow: Modified (exists in both but has been changed)
-
Red: Deleted (exists in the source but not in the destination)
-
-
Configuration Types Chart: The main chart shows a list of all Jira configuration items (Boards, Fields, Groups, Workflows, etc.) and a bar graph visualizing the number of items in each change category. In the example screenshot, 243 "Field configuration schemes" have "No change," and all other items show 0 changes.