About this Page
The Site Health Reports page is a diagnostic dashboard within the Revyz Command Center. It provides a real-time inventory of your Confluence instance, categorizing data by health parameters to help administrators identify restricted content, organizational gaps, and instance-wide configurations.
What is the Use Case?
Administrators use this page to maintain visibility and security across their Confluence site. Key use cases include:
-
Security Auditing: Quickly identifying restricted blogs and pages to ensure access controls are correctly applied.
-
Content Organization: Monitoring the use of labels and space categories to improve searchability.
-
Instance Inventory: Getting an immediate count of specific content types across all spaces without manual searching.
-
Reporting History: Viewing health snapshots based on specific dates/times to track instance growth or changes.
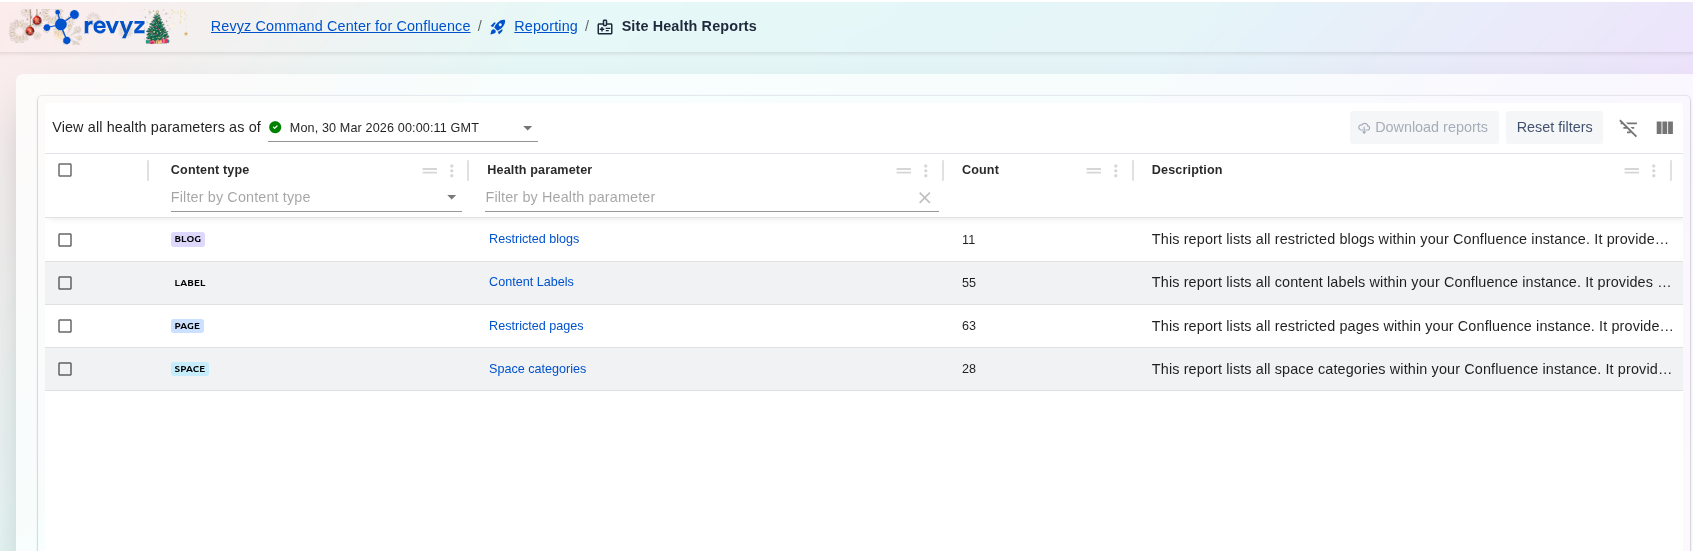
Health Parameters
-
Restricted Blogs/Pages: Lists all content with restricted viewing or editing permissions. It provides key details for each restricted blog, including the blog name, associated space, author, creation and last modified dates, and current status.
Read more about backup and restore of Restricted Content.
-
Content Labels: Tracks the total number of labels used across the instance to manage taxonomy. It provides key details for each content label, including the label name, associated content.
-
Space Categories: Provides an overview of how spaces are grouped and organized.